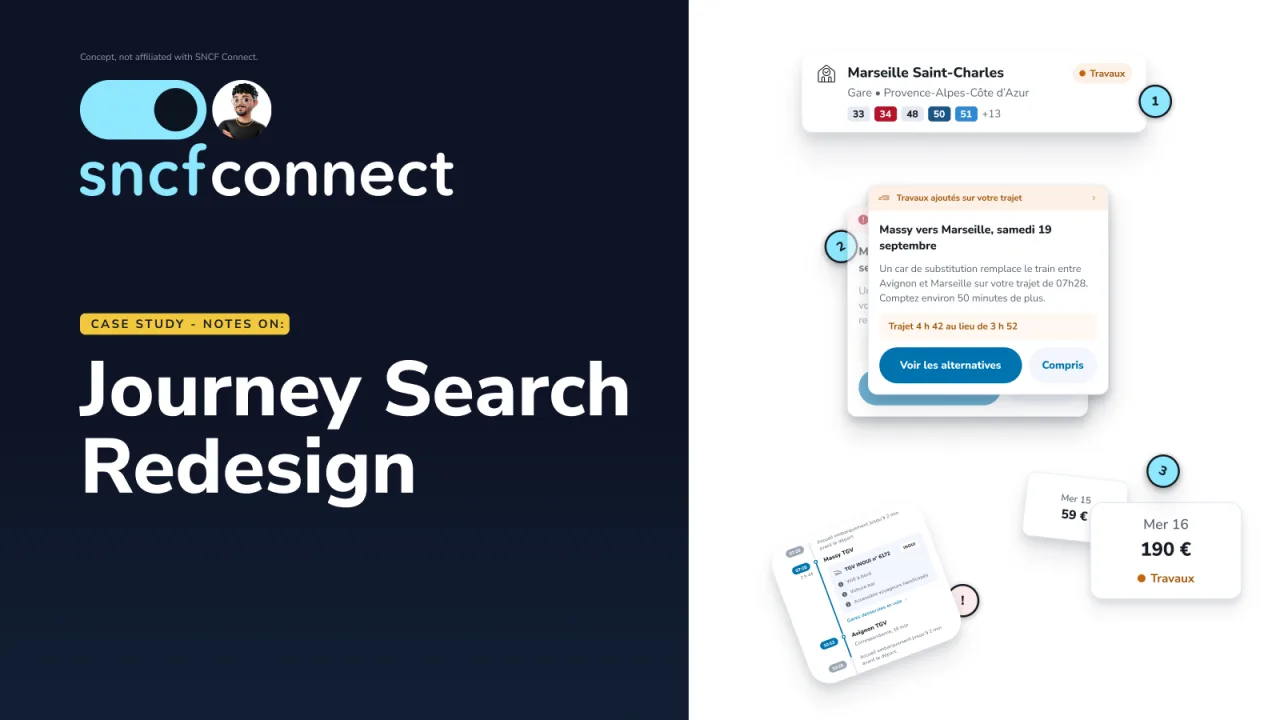
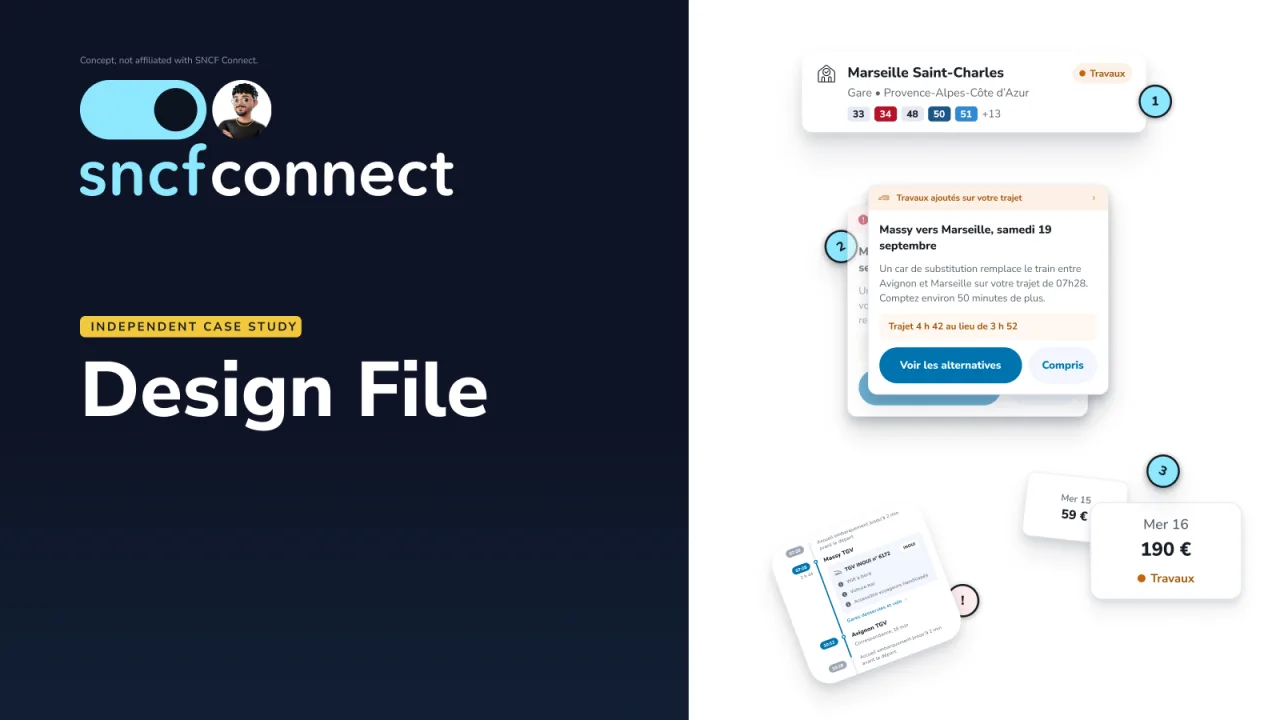
SNCF Connect already writes good copy about engineering works and replacement coaches. It just never shows it where people choose their train. I redesigned the results page so travellers see the disruption, its type and the real journey time before they book.
Role: research, framing, UX, UI, prototyping, testing (solo)Timeline: about two weeks, September 2026Tools: Figma, Dovetail, React, TypeScript, Vite
ⓘ
Independent concept case study. Not affiliated with SNCF Connect.
SoloAll of it is my own work: research, framing, UX, UI, prototyping and testing.
A usual route that stopped being suggested, and nobody said why.
The trigger came while using Citymapper: my usual route stopped being suggested and I didn't know why. It turned out the line had engineering works. The question that stuck: what if the traveller could see and shape their own trip instead of being quietly rerouted around a problem nobody told them about?
I took that question to SNCF Connect's disruption handling, where the same gap shows up at the moment people book.
Read the detail
During my studies, a seven-week team project on navigating an unfamiliar station taught me that journey planning hides smaller, harder problems underneath the obvious one.
The problem
Real information, wrong moment.
SNCF writes disruption content well, but it lives after the decision point. Travellers book first and discover the coach later.
The content exists and it is well written. It just arrives one lane down and several screens too late.
Cost for the traveller
Booking blindly, planning the wrong arrival time, and not being able to weigh price against risk.
Cost for SNCF
Calls, complaints, refunds, lost trust and lost conversion.
Discovery
It looked simple, so I didn't take it at face value. Seven findings, one pattern.
Three flows audited live: desktop, mobile web and the app
A competitive audit across three products
Three proto-personas and eleven features weighed
Citymapper
Surfaces the disruption, but doesn't explain it.
Trainline
Showed nothing.
Google Maps
Reroutes silently.
Sarah, 29
Daily commuter.
Marc, 45 · priority scenario
Occasional long-distance traveller.
Liliane, 68
Needs clear, high-contrast information.
Proto-personas drawn from the framing and the audit, not validated through interviews.
The eight that made it reuse one card, one strip and one detail sheet, which is why they cost so little. The three parked ones are not detailed here.
I audited three flows live on desktop, mobile web and the app: long-distance search, the results list, and the Info trafic page. Seven findings, one pattern: the content exists and is well written, but never arrives at the moment of choice.
Every observed action became a possible feature. Eleven were plotted on impact against effort. Eight were low effort, because they reuse one card, one strip and one detail sheet.
Framing
If we show the disruption directly in the results list, travellers can make an informed choice before buying their ticket, and SNCF gets fewer customer service calls.
The secondary measure moves first and can be read straight off the results list. The north star confirms later, and the guardrail says when to stop.
The redesign
One severity language at every decision moment: icon, label and colour together, never colour alone.
01
Before the results
The destination station is flagged in autocomplete, and date chips mark the days with works.
02
The result card tells the truth
A tinted strip (« Travaux, car de substitution ») and the honest duration (« 4 h 42 au lieu de 3 h 52 »), with the direct alternative right below.
03
A filter, with a way back
A switch hides disrupted journeys, and a row brings them all back. The traveller decides; the product doesn't decide for them.
04
SNCF's own drawer, corrected
« Ce trajet en détail » now names the works and marks the affected part of the trip.
One card, seven states. Every disruption uses the same icon, label and colour together, never colour alone.
Two disruptions
The strips stack on the same card, with no "+1" badge.
Unknown status
Its own neutral state: missing information is information too.
No alternative
No fake alternative when none exists.
40
Primitive tokens
26
Semantic tokens, Day and Night modes
7
States on one result card
16
Screens at 1440 and 393
Figma design file · discovery, design system, screens, testingOpen in a new tab ↗
What changed, and why
Three ideas dropped early, one corrected late.
Dropped
A bigger works banner
It stays disconnected from the journey it affects.
Dropped
Automatic rerouting
It overrides the traveller's choice.
Dropped
Redesigning Info trafic
It answers a different question.
Corrected
My panel, replaced by SNCF's
While building the coded prototype I found SNCF already has a detail drawer that shows a correspondance but never says why. I dropped my own panel and corrected theirs: one notice, one marked part of the trip.
Today's results list beside the redesign. The disruption moves from nowhere to the card you are about to choose.
The detail drawer. Today it shows a correspondance without saying why; corrected, it names the coach and marks the part of the trip it affects.
Accessibility
Severity is never colour alone.
Icon, label, colour
Each severity pairs a distinct icon and a written label with its colour.
Semantic HTML
Each card is an article, the filter a real checkbox, and the detail drawer a focus-trapped dialog.
VoiceOver
Tested with VoiceOver on iPhone. Each card reads departure, arrival, disruption, duration, then price, so the disruption is never the last thing heard.
Contrast
Checked programmatically across every route, both themes and both breakpoints, against WCAG 2.2 AA thresholds.
What I tested
Five people, two products: 0 of 5 against 4 of 5.
Moderated, within-subjects, mobile web. Five participants plus a pilot, today's SNCF Connect against the redesign, order counterbalanced (3 saw today's site first, 2 the redesign first). Directional, not statistical.
Measure
Today's site
Redesign
Knew their chosen train was affected before opening it
0 of 5
4 of 5
Ease of telling which trains had problems
about 0 to 1 / 10
7.8 / 10
Chose the cheaper coach journey knowingly
n/a
3 of 5
Found « Suivre ce trajet » unaided
n/a
2 of 5
Glance recall (out of 3)
1.0
0.9
Glance recall barely moved: the gain is understanding while choosing, not memory.
"I did not understand that the train I chose gave me problems." P3, today's site
"It doesn't say anything about my train having problems. It just says I have to change." P4, today's site
The limits
Five tech-savvy participants. The live site was tested on Paris to Dijon and the redesign on Massy to Marseille. I moderated my own design, and some prompts were leading.